The following infographics about water provide interesting statistics and information about the present and future of the world’s freshwater resources.
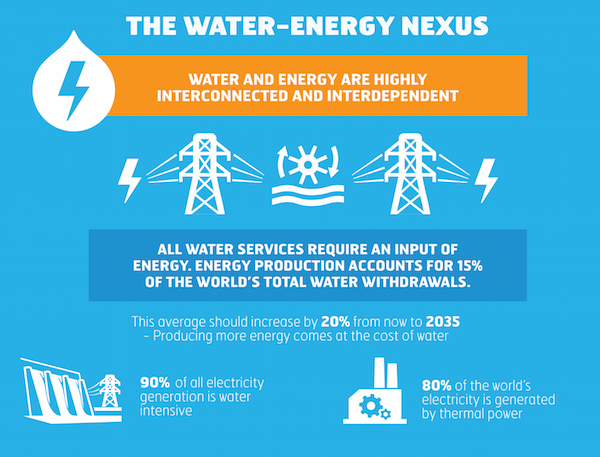
This infographic by UN Water explains how water is required to provide adequate energy for the world. Energy production accounts for 15% of global water withdrawals.
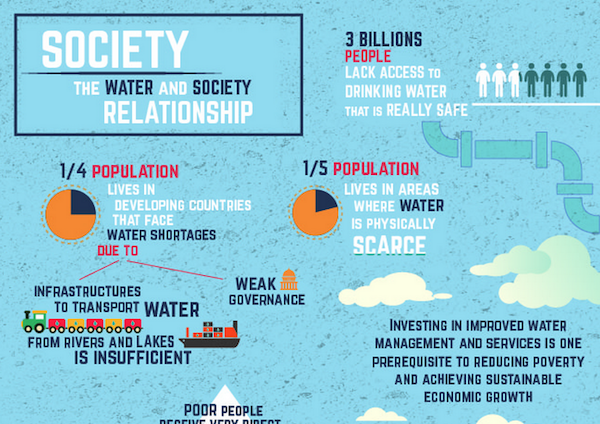
Another infographic by the UN displays stats on water availability and sustainability for the future.
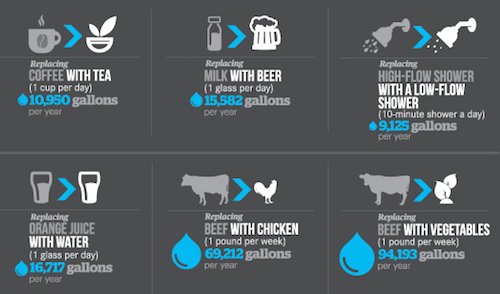
This infographic nicely displays the water footprint of different goods.
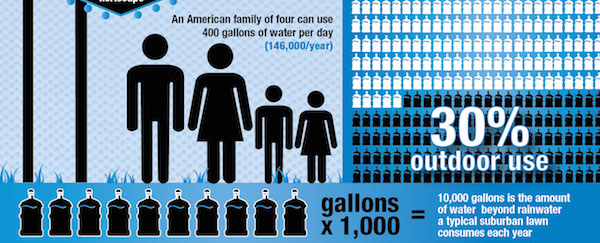
According to the following infographic, a typical suburban lawn uses 10,000 gallons per year in addition to rainwater.
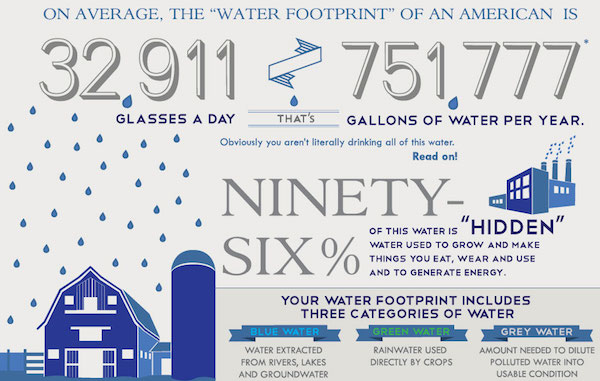
The Nature Conservancy explains the hidden water footprint of Americans, estimated at 751,777 gallons per year.
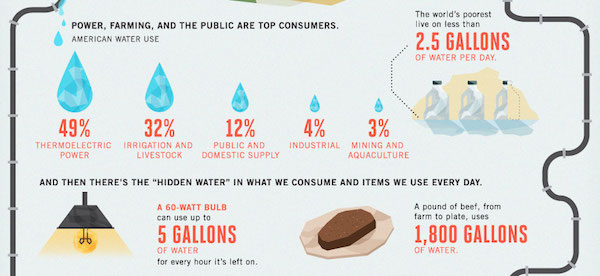
Take Part outlines water challenges faced by the United States including the $1 trillion estimated price tag to upgrade America’s water infrastructure over the next 25 years.
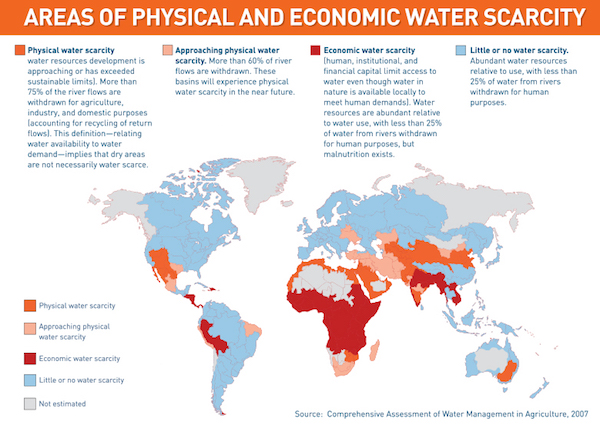
The Food and Agriculture Organization of the United Nations displays a map of the parts of the world facing the most water scarcity.
Water Use it Wisely provides great visualizations about water conservation including a breakdown of household water use.

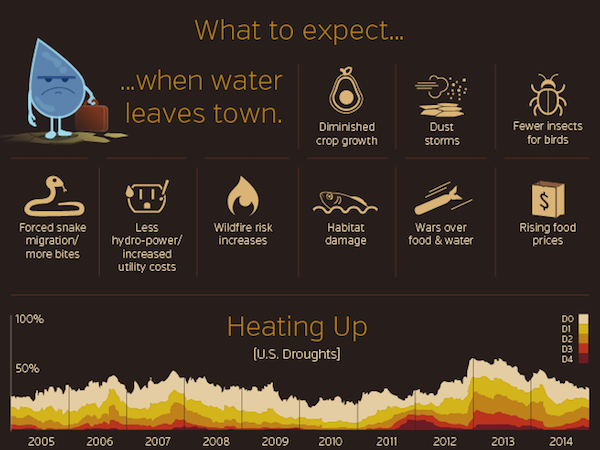
Weather Underground describes the consequences when water supplies are reduced by drought.
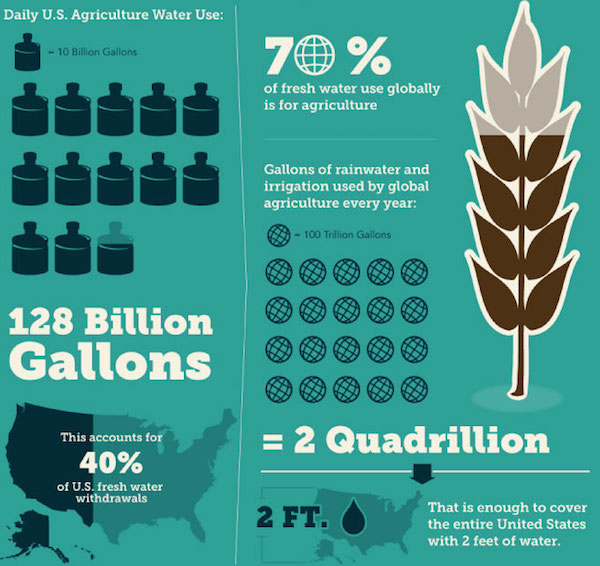
Our infographic about farm water conservation shares interesting facts about the water consumed by U.S. agriculture.
Do you have an excellent infographic about water to share? Leave it in the comments below.